Apply calibration
This notebook shows how to convert contrast data to masses using known calibration parameters
The calibration function is defined as contrast = f(mass) = slope * mass + intercept
[1]:
from pyphotomol import (
    MPAnalyzer,
    plot_histogram,
    plot_histograms_and_fits,
    PlotConfig,
    LayoutConfig,
    LegendConfig
)
from scripts import display_figure_static # Only for static display, to be shown in GitHub
[2]:
file = '../test_files/demo.h5'
mp = MPAnalyzer()
files = [file] * 3
names = [f'demo{i+1}' for i in range(3)]
mp.import_files(files, names=names)
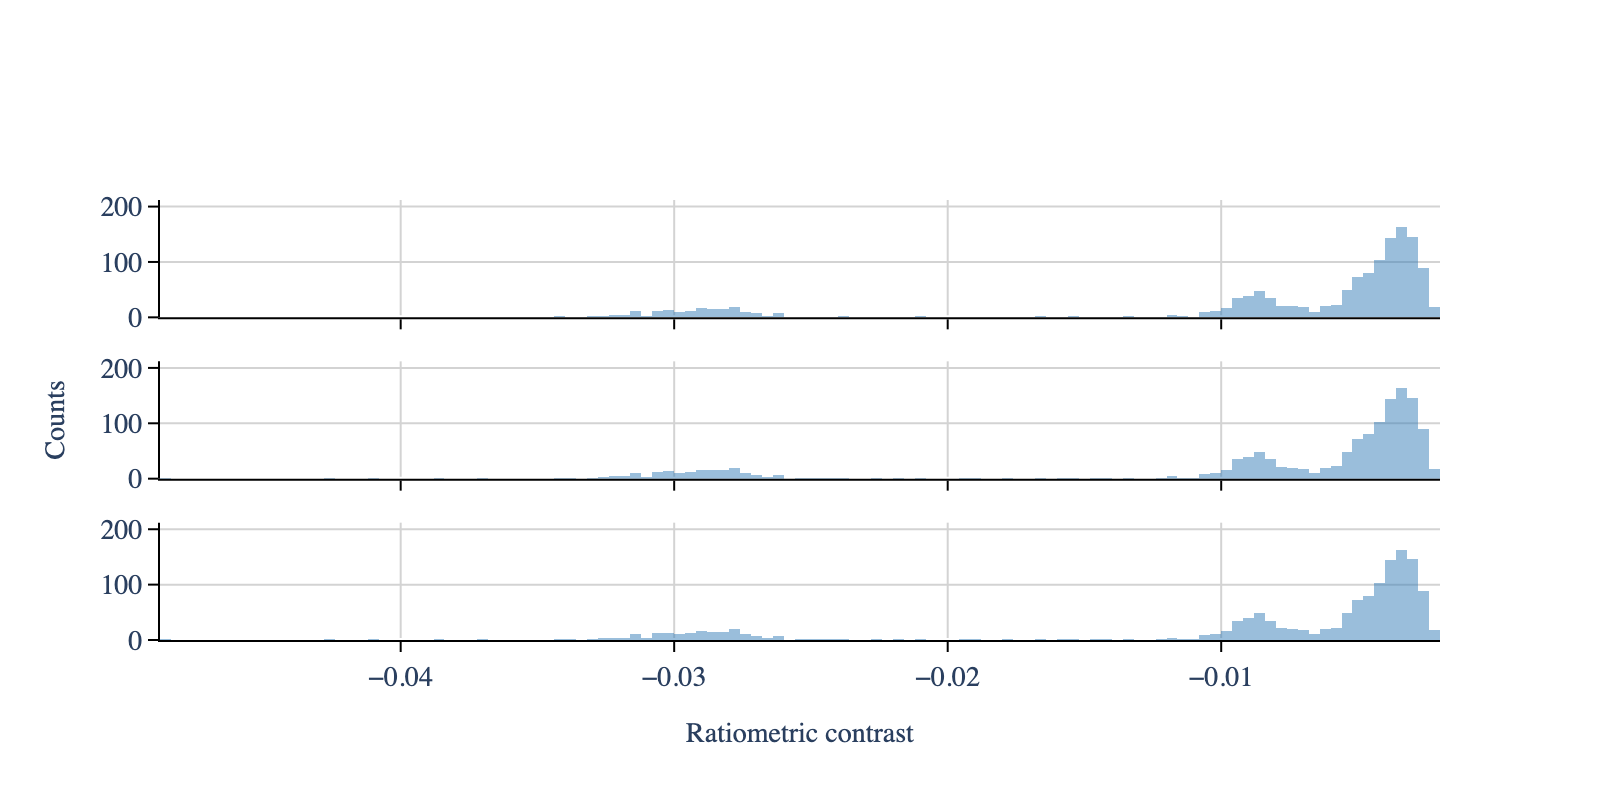
mp.apply_to_all('count_binding_events')
# Create the histogram - same window and bin width for all files
mp.apply_to_all('create_histogram', use_masses=False, window=[-0.05, 0], bin_width=0.0004)
# Create configuration objects
plot_config = PlotConfig(contrasts=True)
layout_config = LayoutConfig(stacked=True,extra_padding_y_label=0.02)
fig = plot_histogram(mp,
plot_config=plot_config,
layout_config=layout_config)
display_figure_static(fig, height=400)
[3]:
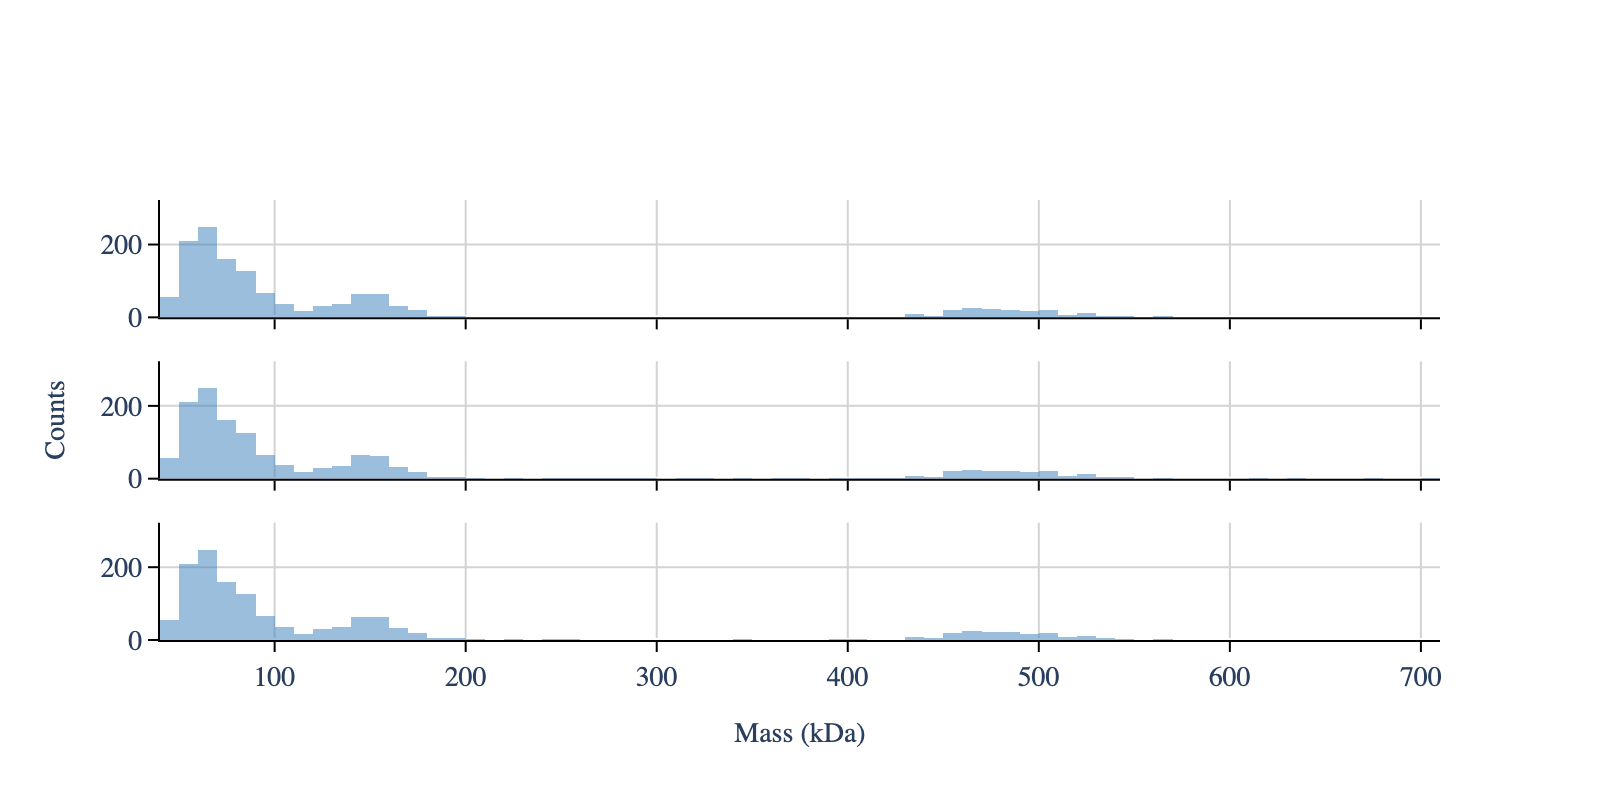
# Apply the calibration
mp.apply_to_all('contrasts_to_masses',
                slope=-6.115911272669366e-05,
                intercept=0.0004374498828378568)  # Taken from notebook 3

# Create the histogram with masses
mp.apply_to_all('create_histogram', use_masses=True, window=[0, 800], bin_width=10)

fig = plot_histograms_and_fits(mp, layout_config=layout_config)
display_figure_static(fig, height=400)
[4]:
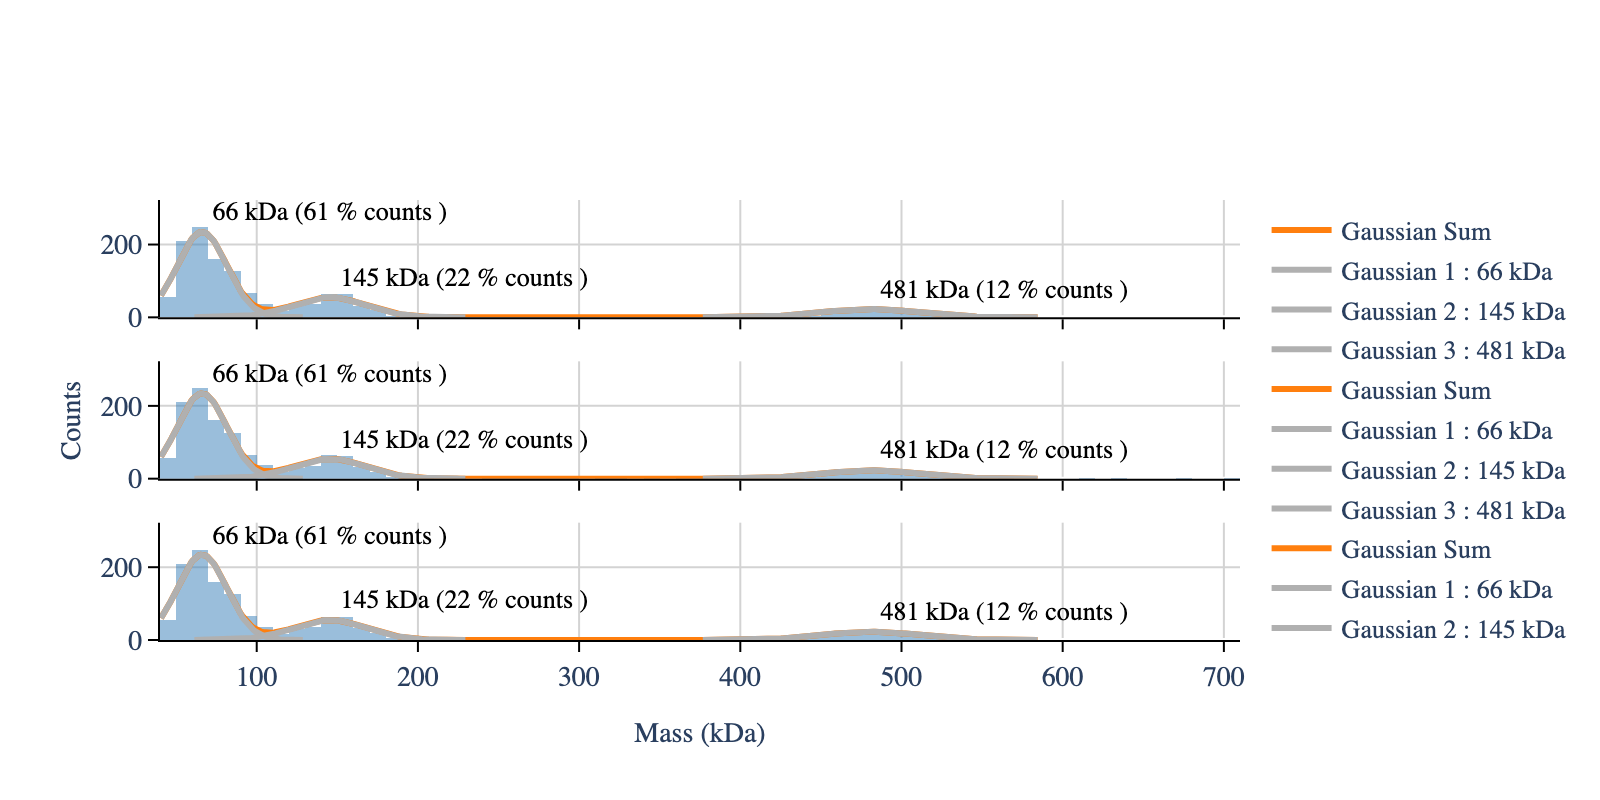
# Fit and plot the fit
# Fit the mass distribution using a multi gaussian
mp.apply_to_all(method_name='fit_histogram',
                peaks_guess=[65, 145, 465],  # Initial peak guess, same for both files
                mean_tolerance=100,  # Tolerance for the mean of the gaussian
                std_tolerance=100,  # Tolerance for the standard deviation of the gaussian
                threshold=40,  # Minimum observed value for the masses
                baseline=0)  # Baseline value for the fit

# Create configuration objects
layout_config = LayoutConfig(
    stacked=True,
    extra_padding_y_label=0.02
)

fig = plot_histograms_and_fits(mp,
                               layout_config=layout_config)

display_figure_static(fig, height=400)